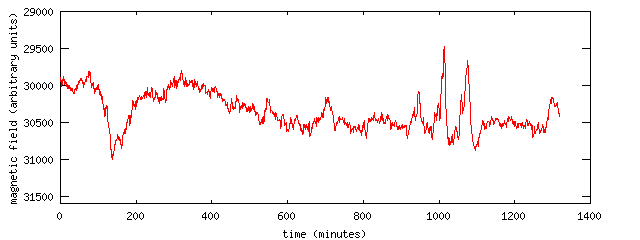
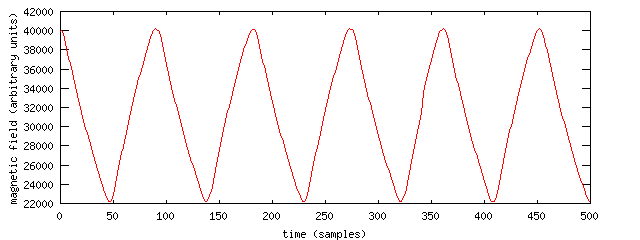
This is an actual geomagnetic field plot (the first one I recorded
with my magnetometer), recorded on the 6th of December 2003. Values
are one-minute averages.
For comparison, here is a plot from the Finnish Meteorological
Institute's professional research-grade magnetometer at Nurmij‰rvi,
at the same time—observe the X-component. Note that this was
not an actual geomagnetic
storm: fullscale variation in X is on the order of only a
hundred nanotesla. Wow, my magnetometer gave nearly identical data!
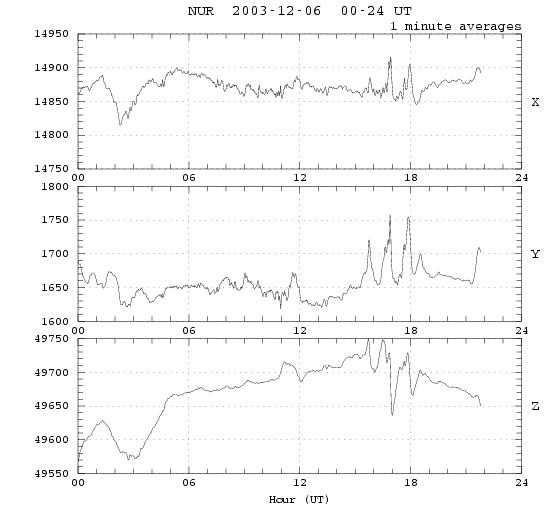
(Image courtesy of the Finnish Meteorological
Institute, Geophysical Observatory. Used with permission.)
Increase the sample rate a bit.
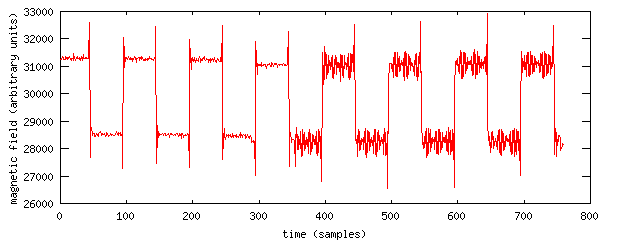
This is a battery-operated alarm clock, and the sample rate looks like
50 samples/sec. At t=350 the clock begins to ring—time to wake
up!
This was sampled at 4500 samples/sec. Hmmm... A 50 Hz signal... Yep,
that's a small power-supply transformer. (Actually, the
comparator-integrator circuit doesn't really work as a true low-pass
filter this close to its cut-off frequency, and makes a triangle wave
of the original sine.)
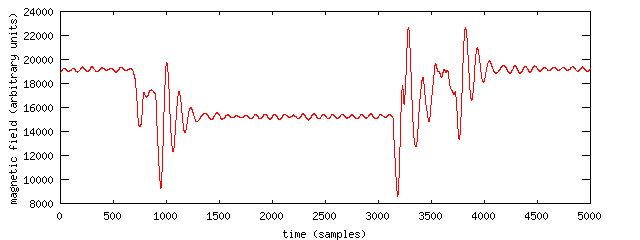
This is also at 4500 samples/sec: My Canon EOS-3 camera takes a
photo. The 1/2 second exposure time is clearly visible (from about
1000 to 3200 on the time axis). Lots of 50
Hz hum as well—that's why I usually have a larger capacitor in the
low-pass filter.